

We are a pioneer in innovative data driven technology and sustainable solutions with more than 24 years of experience in the energy industry.
Experience
Our specialized divisions:


tde digital – Featured products:
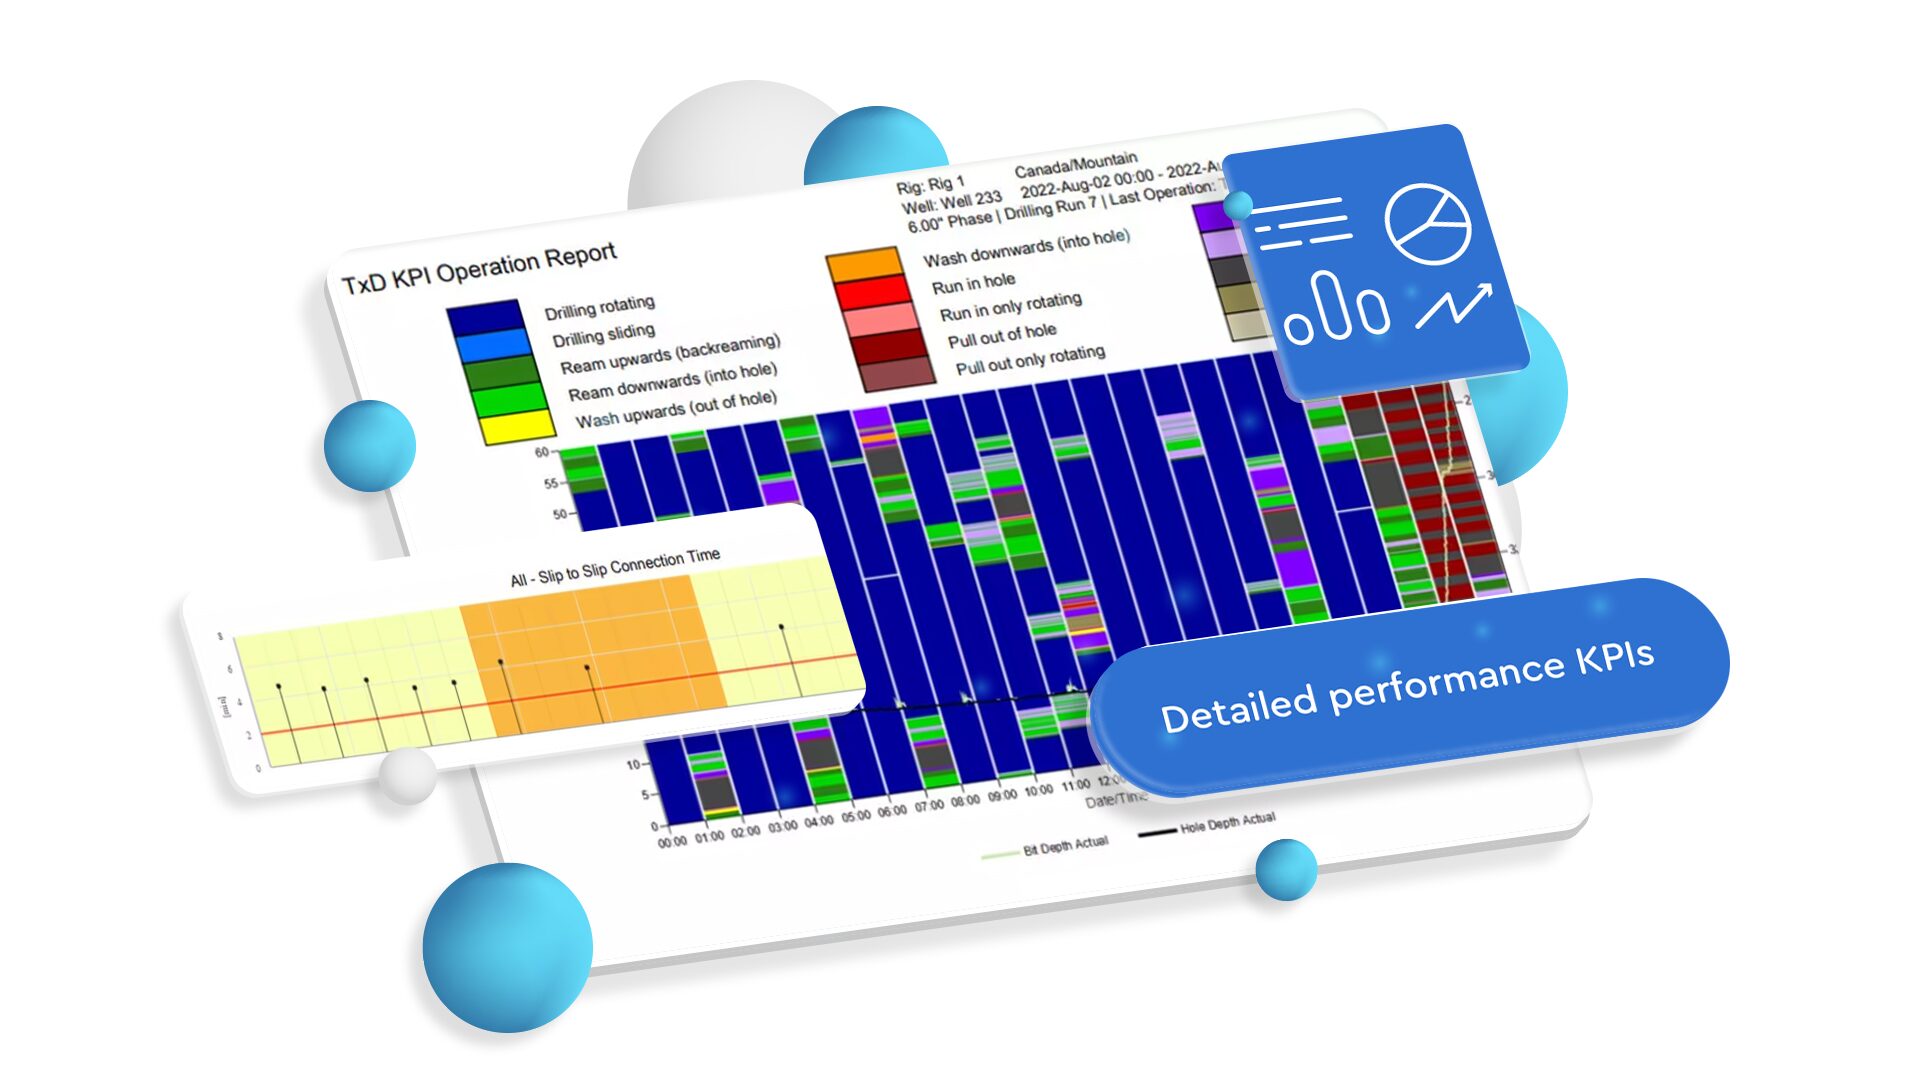
Performance evaluation
tde pronova

tde pronova is a global standard and independent performance evaluation platform with proven savings and customer satisfaction while reducing environmental impact.
Downhole power and communication
tde powerline

tde powerline will be the industry’s first power and data highway technology, an intelligent digital drilling system, which is a key enabler for drilling automation at the edge.

Why tde?
Innovation
and Expertise
Embrace over 20 years of leading in data-driven tech and sustainability. Our global reach and local insights provide tailored strategies, keeping you ahead in the ever-changing energy sector.
Sustainable
Excellence
We’re committed to transforming the energy industry into one that’s both productive and green, underlining your commitment to a better planet.

Partner for
progress
Our partnership philosophy means your success is our success. Benefit from our track record of enhancing operational excellence and sustainability.
Downhole power and communication 
tde powerline
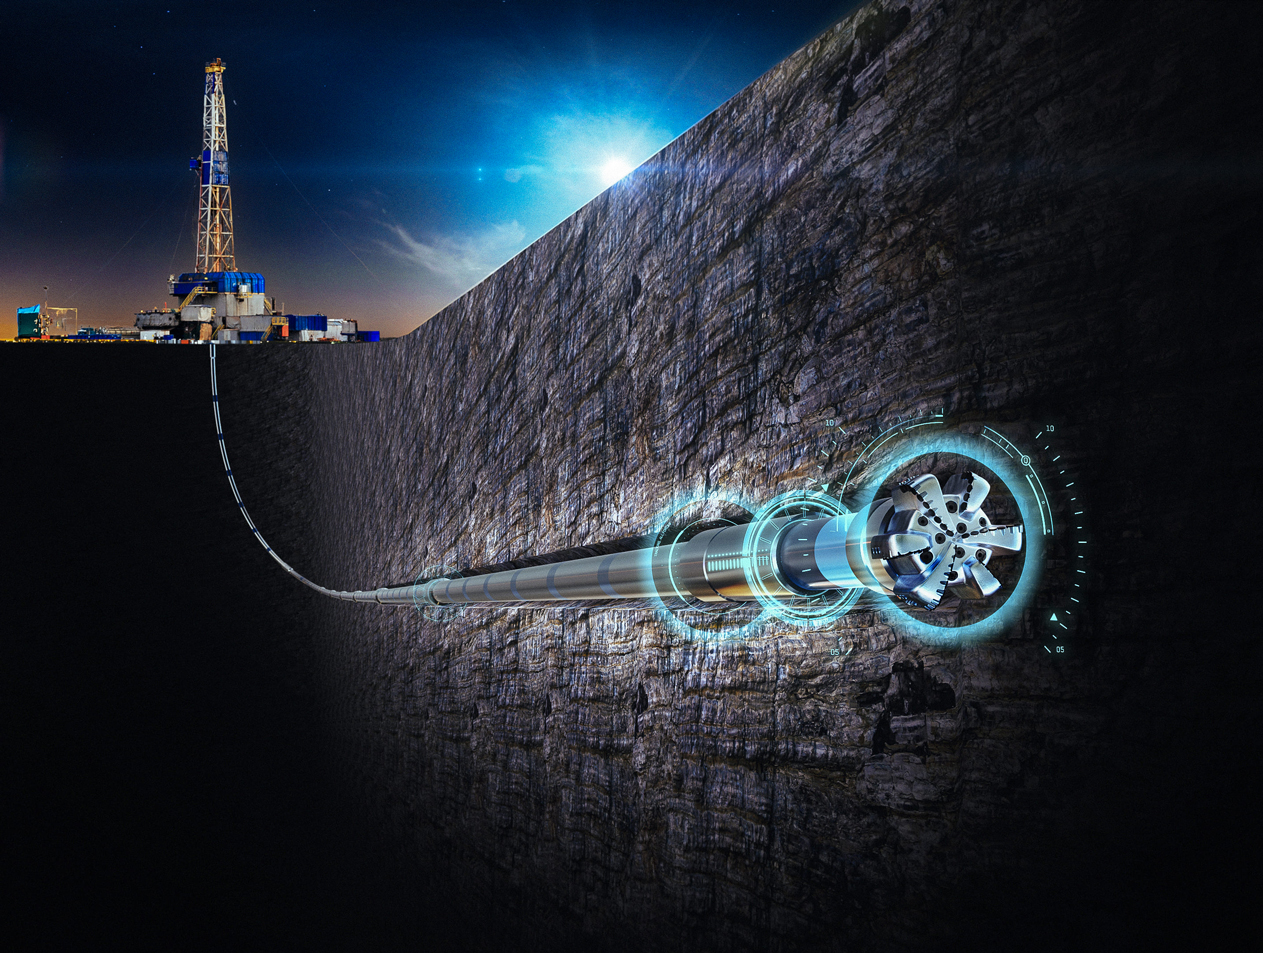
tde powerline is the first power and data highway technology, an intelligent digital drilling system, which is a key enabler for drilling automation at the edge. Our tde powerline service enables a continuous, ‘always-on’ view of conditions near the bit and along the string. This capability drives immediate, fully informed, and actionable decision-making.
Log in to view detailed information about this product
Surface sensor and control
tde sona

tde sona is the fully automated multi-measurement system to optimize production in brownfield wells. A key enabler for measurements with minimum work force effort to reduce HSE risk on-site, with high flexibility and mobility.
Log in to view detailed information about this product
Performance evaluation
tde pronova
tde pronova is a global standard and independent performance evaluation platform with proven savings and customer satisfaction while reducing environmental impact.
Log in to view detailed information about this product
Operations optimization
tde empower
tde empower is the exclusive network of tde experts supported by our data driven technologies. They are dedicated to identifying performance gaps in your operations, seizing savings opportunities, and reducing emissions through a comprehensive analysis of your real-time data.
Log in to view detailed information about this product