Record-Breaking Data Ingestion
Executive Summary
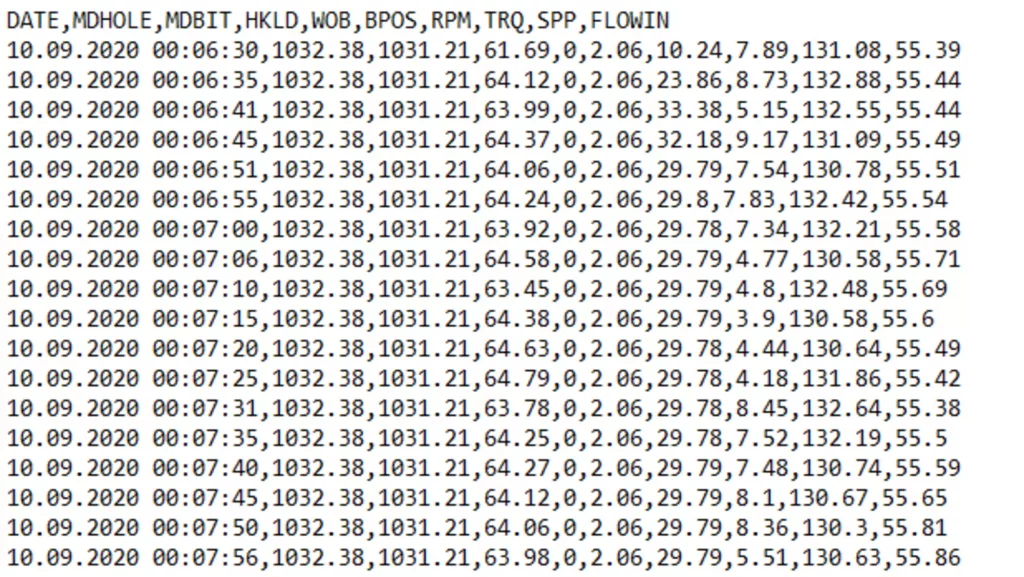
Over the last few decades, while most industries seemed to grow alongside the world’s exponential technological advancements, the oil drilling industry remained somewhat stagnant, often using simple Excel charts extrapolated from imported 8 channel CSV data for making operational decisions. This was hardly efficient and led to massive amounts of “Invisible Lost Time” throughout the industry. Prof. Gerhard Thonhauser recognized that the more variables one could measure, compare and analyze, the more one could improve operational efficiency. Predicated upon this idea, Thonhauser Data Engineering GmbH was formed and has accelerated the evolution of digital drilling data analysis ever since.
As the industry started to catch up with technology and agree with Thonhauser’s theory, a user friendly and intuitive automated online platform was needed that could handle, process and analyze the ever-increasing amount of raw data from additional data channels. In the early 2000’s TDE released proNova, the first such online platform, based upon TDE’s patented Automated Operations Recognition System. proNova analyzes drilling data in real time, offering operators and contractors a myriad of tools for instantly visualizing data, empowering them to make quick and thoroughly informed in the pursuit of maximum drilling efficiency.
However, the first step to improving drilling efficiency is not simply TDE’s automated day to day service. proNova requires months or even years of historical data in order to set Key Performance Indicator benchmarks from which to improve. In conjunction with proNova, this raw data ingestion needs a team of processors.
In 2019, a large oil company tasked proNova with processing and analyzing more than 250GB (45 rigs and 155 wells) of raw data in 40 days. The 8-person team finished the job two days early and made a huge impression on the would-be client. Coincidentally, in 2020, proNova was again asked to perform a similar task. Only this time, it was to be 500GB in just 60 days, including additional guidelines.
Challenge
During the summer of 2020, the proNova team was expected process more than 500GB and 20,000 rig days of raw historical drilling data, from 140 rigs, in less than 60 days. They processed the more than 475,000 hours of data in just 59 days with only an 8-person team. Essentially, the team heeded lessons learned from an already monumental accomplishment and were over 25% more efficient the second time around. In addition, they did so with the added parameters of quality control and T&D extrapolation.
Historical Data Ingestion
Rigs 140
Wells 290
Days 20000
Raw volume [GB] 500
Raw data format *.csv
TDE personnel involved 8
Approach
To meet the challenge with the additional time constrictions and parameter additions, the huge task had to be broken down into several smaller assignments and delegated accordingly to the revolving team members. The following Gannt chart shows the 11 overlapping steps taken to maximize workflow efficiency.
To meet the challenge with the additional time constrictions and parameter additions, the huge task had to be broken down into several smaller assignments and delegated accordingly to the revolving team members.
Data Acquired
The data package was handed over to TDE including:
Data Transfer
The data was copied to the servers.
Data Pre-processing
The original LAS files, containing the sensor data, were converted to WITSML standards (XML format) for easier handling with respect to our data fetchers.
Rig/Well Composition
All rigs and wells were setup in proNova.
Import
The data fetchers were initiated, and the data was loaded to the scenarios in pronova.
Portal Configuration
Initial setup of the portal – Feature activation, organizational hierarchy and KPI selection
Operations Recognition (incl. T&D)
The pronova rule engine was activated.
Operations Classification
Operations were coded using the morning reports. The wellbore construction elements, along with additional attributes, were added. Sections diameters, jobs and run types were defined.
DDR Entry
Morning reports were loaded into proNova.
Register Crew/Shifts
Crews and shift types were loaded.
Quality Control
All aspects were quality controlled and finalized.
How pronova helps
Measure performance. Quantify improvements. Accumulate lessons learned. proNova’s customizable online data analytics and tools enable users to make prompt informed decisions, facilitating continuous improvement and, in turn, savings. Whether real-time or historical data, proNova can process it in record time…if not instantly.
Quite simply, pronova turns this…

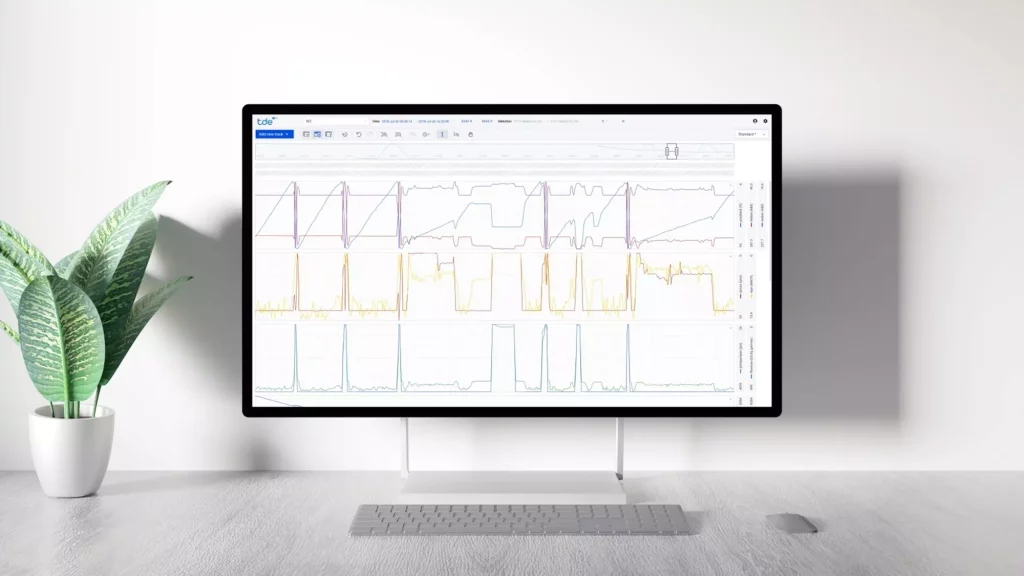
…into this:


